
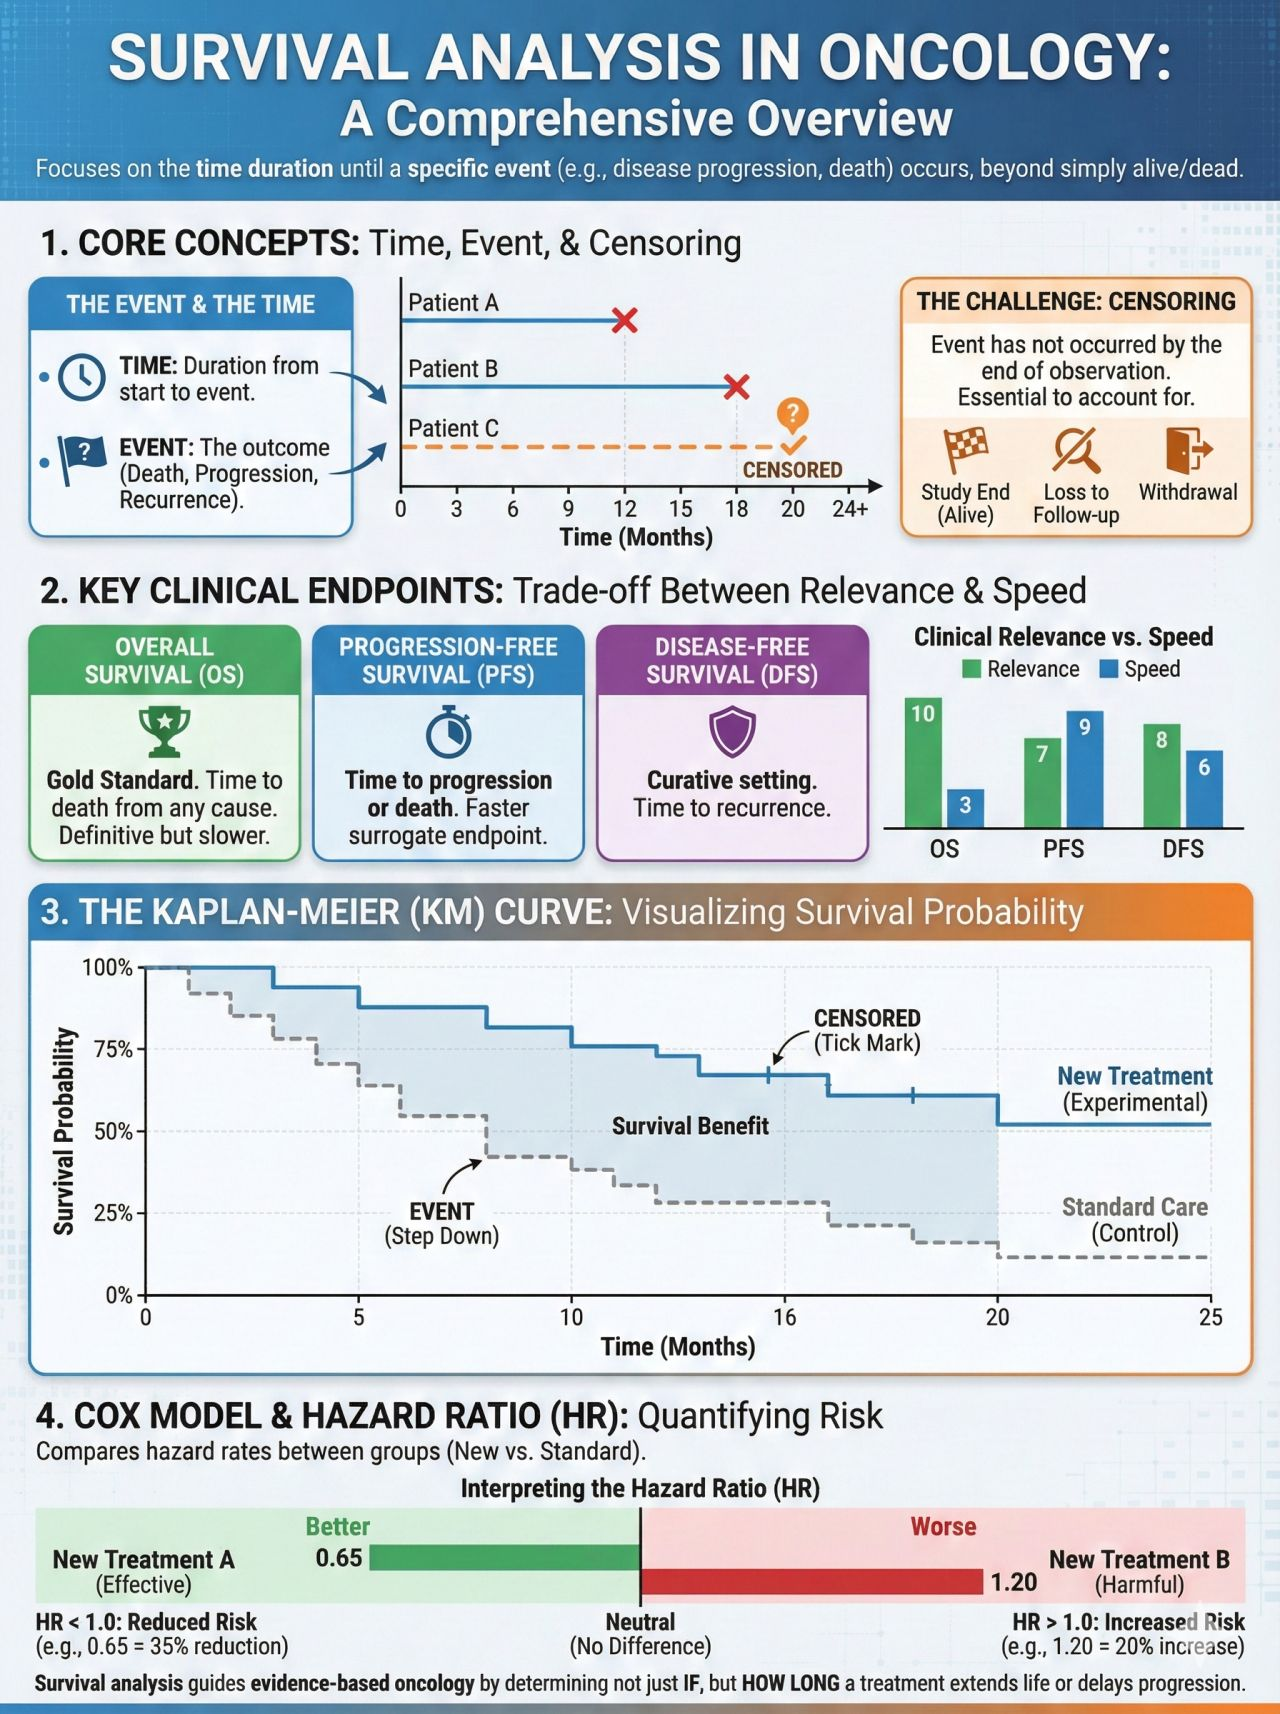
Kaplan-Meier Curves in Oncology

Introduction
Kaplan-Meier (KM) survival curves are foundational to oncology clinical trials and can be central to how efficacy is assessed for cytotoxic chemotherapy, targeted therapies, immunotherapies, and cellular therapies. Endpoints such as overall survival (OS), progression-free survival (PFS), event-free survival (EFS), and duration of response (DoR) are almost universally presented using KM methodology.
For oncology pharmacists - whether practicing clinically, serving on P&T committees, or working in medical affairs - accurate interpretation of KM curves is essential to evaluating clinical benefit, understanding risk-benefit tradeoffs, and communicating trial results responsibly.
What a KM Curve Represents in Oncology
A KM curve estimates the probability that a patient remains free from a pre-defined event over time. In oncology, the event is most commonly:
- Death (Overall Survival, OS)
- Disease progression or death (Progression-Free Survival, PFS)
- Relapse, progression, or death (Event-Free Survival, EFS)
- Loss of response (Duration of Response, DoR)
Axes:
- X-axis: Time since randomization, treatment start, or diagnosis
- Y-axis: Probability of remaining event-free (0-1 or 0-100%)
Each downward step reflects one or more events occurring at a specific time point.
Censoring: Central to Oncology Trial Interpretation
Censoring accounts for incomplete follow-up, which is unavoidable in oncology trials.
Patients are censored when:
- They have not experienced the event at data cutoff
- They are lost to follow-up
- They withdraw consent
Censored observations contribute survival information up to the time of censoring but do not count as events.
Oncology-specific nuance:
High censoring rates can be common in PFS analyses, particularly when radiographic assessments are infrequent or when patients discontinue therapy for toxicity before documented progression. Excessive censoring, especially if imbalanced between arms, can bias estimates and complicate interpretation.
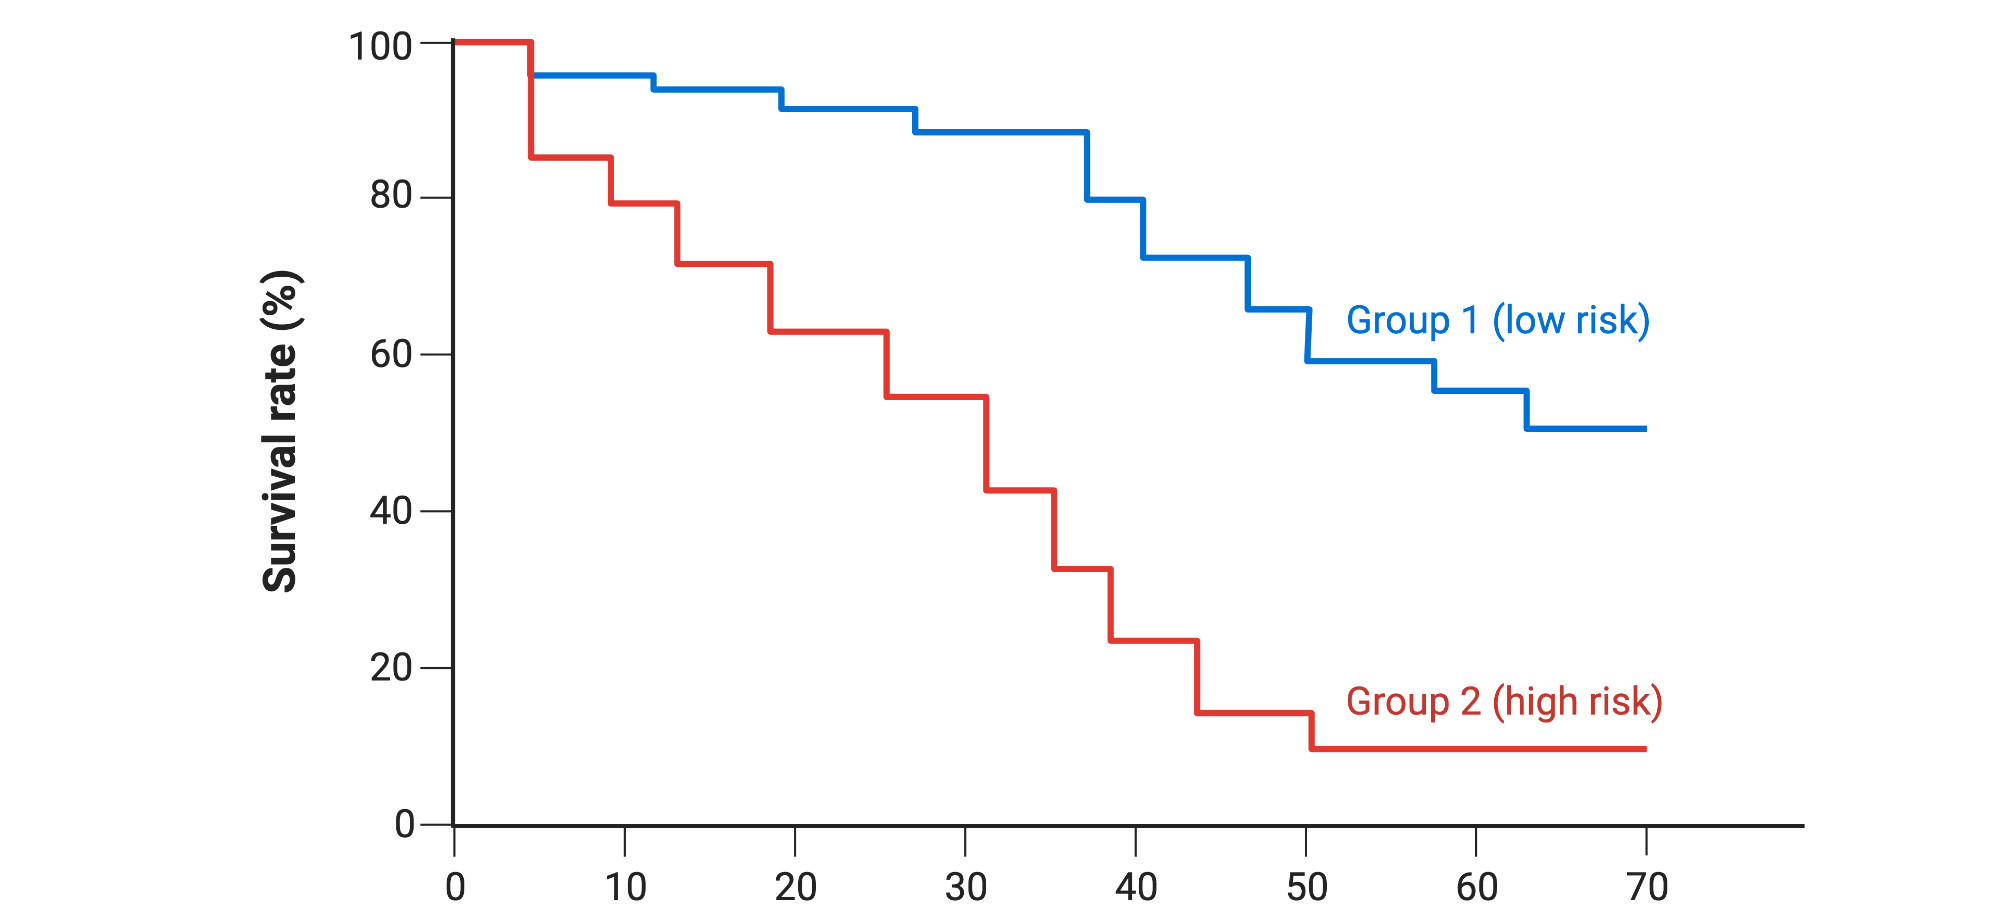
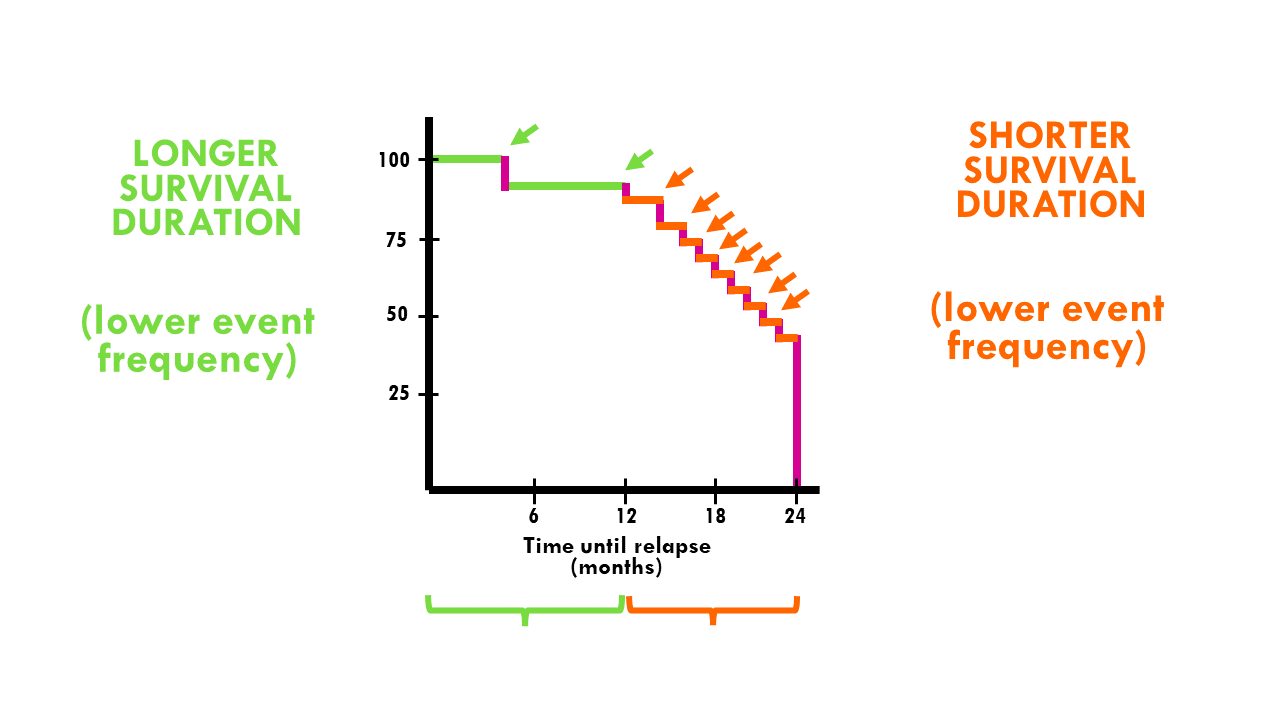
The Stepwise Nature of KM Curves
KM curves drop in discrete steps because survival probabilities are re-calculated only when an event occurs. Larger drops indicate multiple events occurring at the same time point.
This highlights an important principle: KM curves are empirical estimates derived from observed data, not smooth or continuous survival predictions.
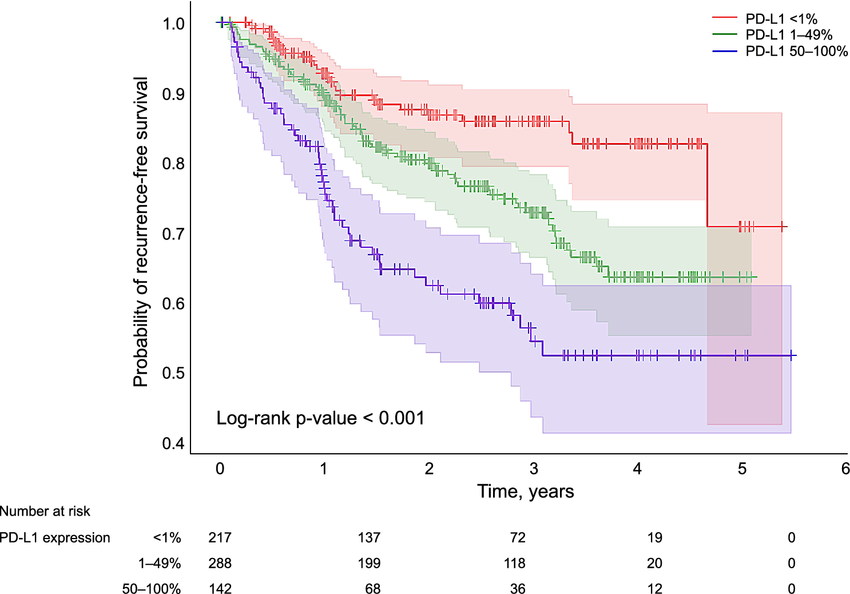
Number at Risk: Assessing Reliability Over Time
The number-at-risk table shows how many patients remain under observation at specified time points.
- Early in the trial: estimates are generally robust due to larger sample size
- Later in follow-up: estimates become less precise as the population shrinks
Oncology pharmacy pearl:
Late separation of KM curves - particularly beyond 24-36 months - should be interpreted cautiously if the number at risk is small. Apparent long-term benefit may be real, but confidence around the estimate is reduced.
Median Survival: Utility and Limitations
Median survival is defined as the time at which 50% of patients have experienced the event.
Strengths:
- Easy to interpret
- Not influenced by extreme outliers
Limitations in oncology:
- May not reflect the full survival distribution
- May fail to capture durable benefit in a subset of patients
- Two regimens may share the same median OS yet show markedly different long-term survival patterns
If median survival is reported as “not reached,” this indicates that fewer than half of patients have experienced the event at the time of analysis, which may reflect prolonged benefit, immature data, or both.
Comparing Survival Curves: Log-Rank Tests and Hazard Ratios
Log-Rank Test
The log-rank test evaluates whether there is a statistically significant difference between survival curves across the entire follow-up period.
Key assumptions:
- Proportional hazards
- Equal weighting of events over time
Limitation:
The log-rank test may lack sensitivity when treatment effects are delayed or when survival curves cross - scenarios increasingly common in immuno-oncology trials.
Hazard Ratios (HRs)
Hazard ratios quantify the relative risk of the event occurring at any time point in the treatment arm compared with the control arm.
- HR <1 indicates reduced risk with treatment
- HR >1 indicates increased risk
Critical oncology caveat:
Hazard ratios assume proportional hazards over time. When this assumption is violated - such as with delayed immunotherapy effects or early toxicity - HRs may inadequately summarize treatment benefit.
HRs may not convey absolute survival benefit and should always be interpreted alongside KM curves and absolute survival estimates.
Early vs. Delayed Curve Separation in Oncology
The timing of KM curve separation often reflects underlying biology:
- Early separation: Can be common with cytotoxic chemotherapy or targeted agents with rapid tumor debulking
- Delayed separation: Can be frequently observed with immune checkpoint inhibitors, vaccines, and cellular therapies
Delayed separation can reduce the apparent magnitude of benefit when summarized by median survival or HR alone, underscoring the importance of visual inspection of the entire curve.
The Tail of the Curve: Long-Term Survivorship
In immuno-oncology, attention is often given to the “tail” of the KM curve, representing patients with prolonged survival.
While clinically meaningful:
- Estimates in the tail are based on fewer patients
- Confidence intervals widen substantially
- Findings are typically descriptive unless pre-specified and adequately powered
Scientific framing:
Durable survival in a subset of patients is hypothesis-supporting and biologically informative, but may not be definitive evidence of cure.
Common Oncology-Specific Misinterpretations
- Interpreting hazard ratios as absolute survival benefit
- Equating median OS improvement with long-term survival advantage
- Over-interpreting late curve separation without adequate numbers at risk
- Using KM curves to predict individual patient outcomes
KM analyses describe population-level risk, not individual prognosis.
Why KM Literacy is Essential in Oncology Pharmacy
Oncology pharmacists routinely use survival data to:
- Evaluate clinical meaningfulness of new therapies
- Inform formulary and pathway decisions
- Counsel providers on expected outcomes
- Support compliant scientific exchange
A nuanced understanding of KM curves enables balanced interpretation of efficacy, toxicity, durability, and uncertainty.
Key Takeaways
- KM curves are the standard method for analyzing time-to-event oncology endpoints
- Censoring and number-at-risk tables critically influence reliability
- Median survival is important to note but can provide limited insight into durable benefit
- Hazard ratios rely on proportional hazards assumptions that may not hold
- Visual inspection of the entire curve is essential
- Oncology pharmacists must integrate statistical principles with clinical context
*Information presented on RxTeach does not represent the opinion of any specific company, organization, or team other than the authors themselves. No patient-provider relationship is created.